Insight
We take your results to the next level by incorporating visual graphs and helpful commentary.
Visual Graphs:
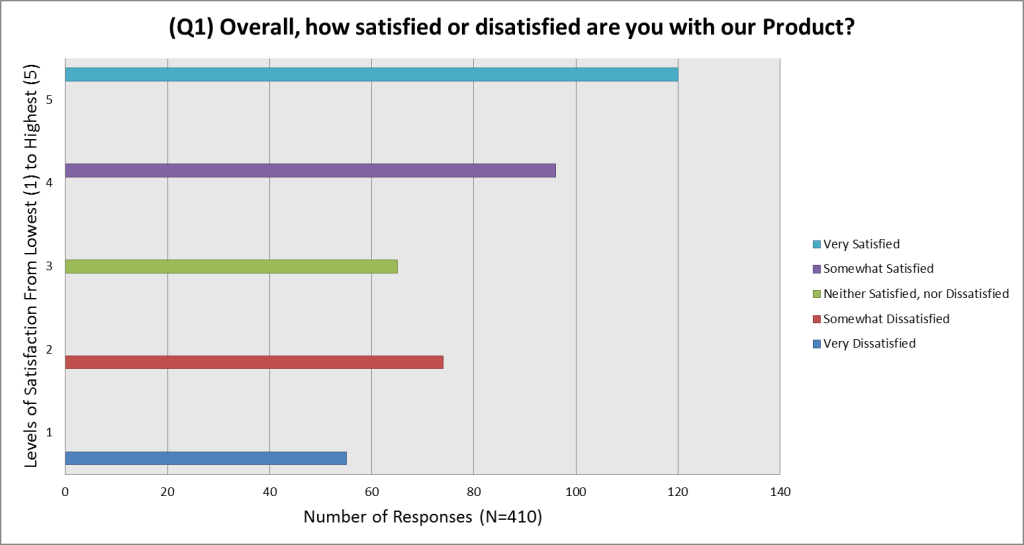
After developing a clear understanding of the data and results, we develop simple, readable graphs to help interpret our findings. Graphs can help turn muddled numbers into a more clear, concise picture of the research.
(Click the image below to see an example)
(Visual Graphs are included with the Gold Package*)
Full Service Report:
For a more comprehensive research project, our full service report includes everything we have to offer: Survey development/design, deployment, response collection, statistical analysis, and visual graphs. In addition, we provide a report with commentary which guides our client through the research process. The following sections are included: Introduction, Objectives, Methodology, Results, Limitations, Conclusions and Recommendations.
(All previous services included with the Platinum Package*)


